很多时候, 我们需要二维的图,x y轴为不同考察对象,而值以颜色显示.
输入数据:
- 这里输入数据格式采用sparse数据格式,前两列为坐标,第三列为值.如:
1 1 2
1 2 4
...
1 667 9
2 1 5
2 2 8
...
1001 667 1
当然这个数据我们知道是2维的,对于不知道维度的,可以在第一行时记录.Sparse数据可以不输入某些值,例如如果大部分数据都是0, 可以只输入非0的,数据储存可以少些,但此时要指明NX,NY,NZ.
- 对于规则型如这个数据1001*667全备的,可以用紧凑型数据,第一行指明维度,第二行第一维的数量NX,第三行是第二维的NY,如此类推.这样数据全读入后,用reshape()函数变换矩阵即可.
###matlab脚本 脚本如下:
clear all;
clc;
% part1: read data
filename='emd_1149-2Dtimesum_0.sdat';
[dirr,filee,extt]=fileparts(filename);
A=load(filename);
% part2: calculate total frames on each axis
imin=min(A(:,1));
jmin=min(A(:,2));
imax=max(A(:,1));
jmax=max(A(:,2));
deltaJ=A(2,2)-A(1,2);
times=abs((jmax-jmin)/deltaJ)+1;
deltaI=A(times+1,1)-A(1,1);
frames=abs((imax-imin)/deltaI)+1;
% part3: construct the 2D-matrix to save the values.
B=zeros(frames,times);
for i=1:frames
for j=1:times
B(i,j)=A((i-1)*times+j, 3);
end
end
% part4: make a Figure
handleN=imagesc(B');
%handleN=imagesc(B(1:500, :)');
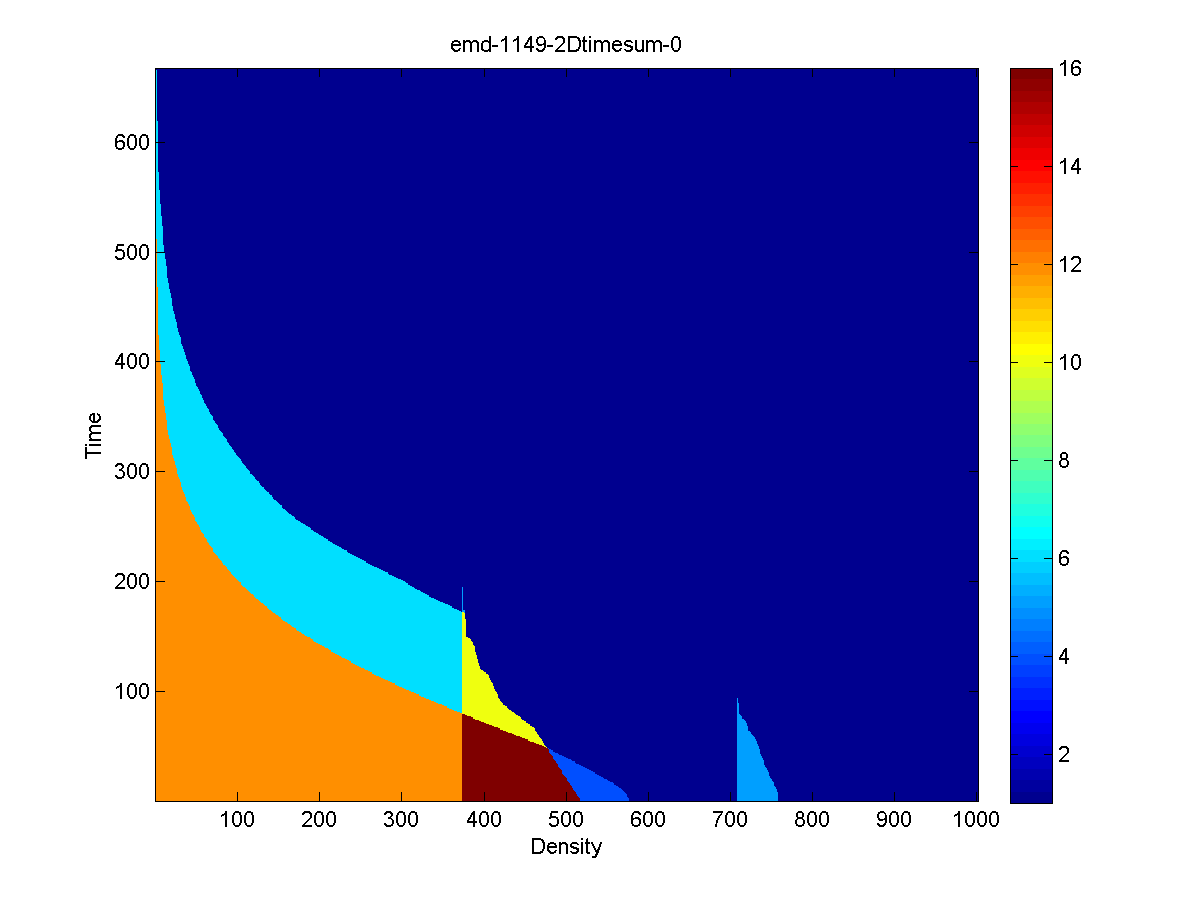
title(strrep(filee,'_','-'));
xlabel('Density');
ylabel('Time');
%reverse the Y axis
set(gca,'YDir','normal');
%set up the colorbar range
%set(gca, 'CLim', [0 20]);
colorbar
saveas(handleN, [filee,'.png'], 'png');
fileparts函数用来对文件名分析.- part2 计算出每列最值和interval,算出帧数
imagesc用来出图,这里对矩阵转置,注释掉一句用于出局部数据.strrep为了防止标题中_会作为下标指示符而进行替换.set (gca,'YDir','normal')一句用来反转Y轴坐标.set(gca, 'CLim', [0 20]);一句用来控制colorbar的值范围.colorbar用来出色带.
出图结果如下:
I don’t know why the matlab syntax highlight can’t work here… I may check it in future.
My prism.js in TOC.js doesn’t contain the matlab.
The matlab in prism is wrong. It will take all things as comments.The comment should be written as:
comment:{pattern:/(^|[^\\])%.*?(\r?\n|$)/g,lookbehind:!0}